Easier debugging using VSCode and pdb
Python Debugging and Tracing
Debugging
I’m honestly surprised it’s taken me this long to actually get around to writing about this.
In my early days I did what everyone who doesn’t know does. I’d just write a lot of print() statements to surface variable values and I’d exit scripts early to review before slowly moving the exit statement further down.

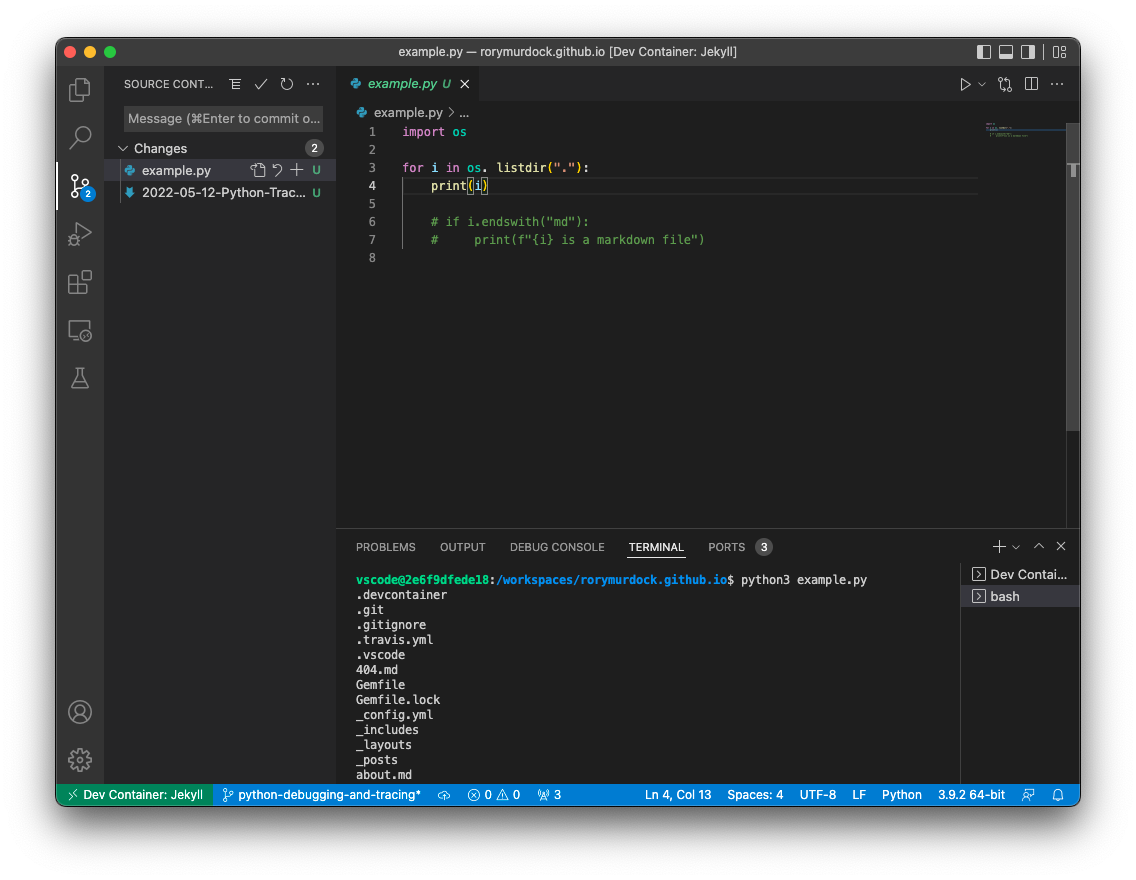
When you start to get bigger and more complex code this becomes kinda crazy and unmaintainable.
Let’s talk about debugging, specifically I will be using the Python debugger in VS Code. They have their own guide that’s also worth reading.
First there’s a few things you should know.
- Breakpoint - This is a point that when the execution hits that line it will stop and you can inspect all the variables and objects
- Conditional breakpoints - The same as above but you can set it to break on conditions
- Watching - When you have lots of objects and variables you can surface specific ones
So let’s start off with a breakpoint
In the gutter click on the line you want to break (pause) at and you’ll get a red dot.
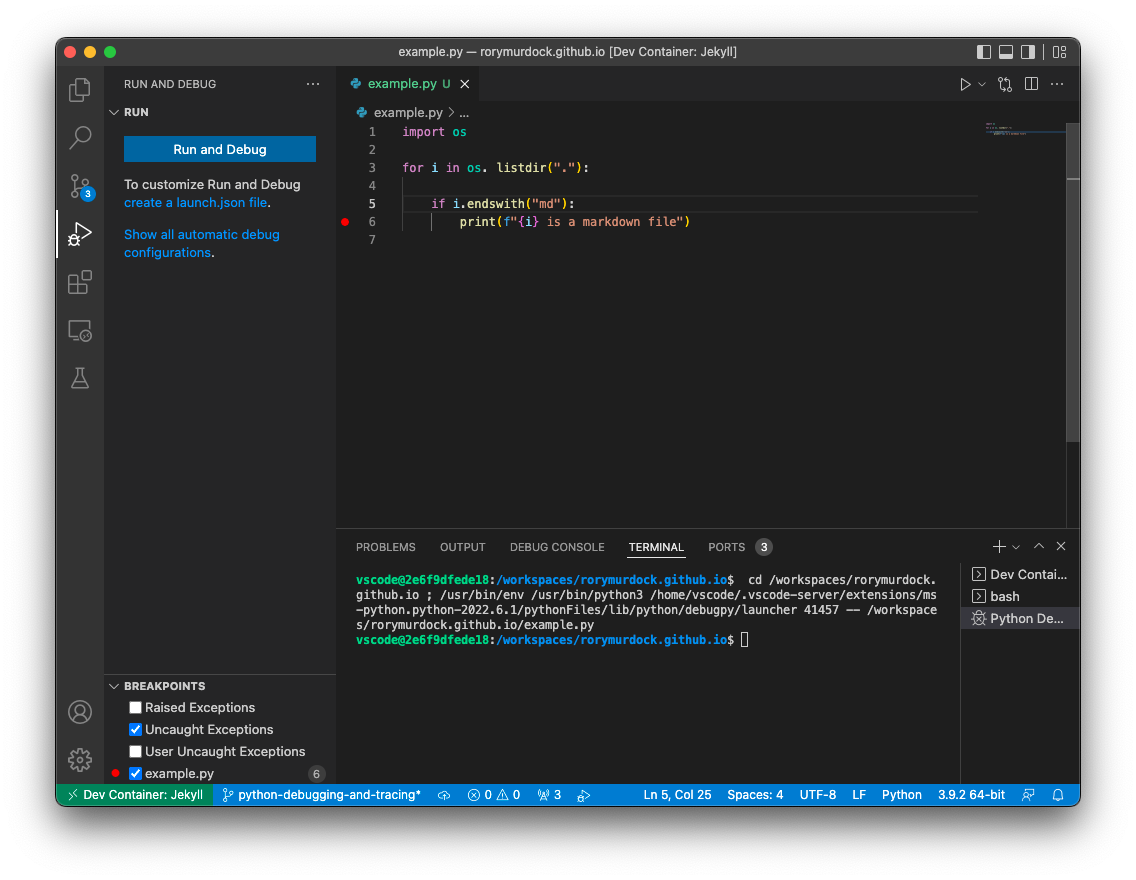
Then press F5 or Run -> Start debugging from the menu bar.
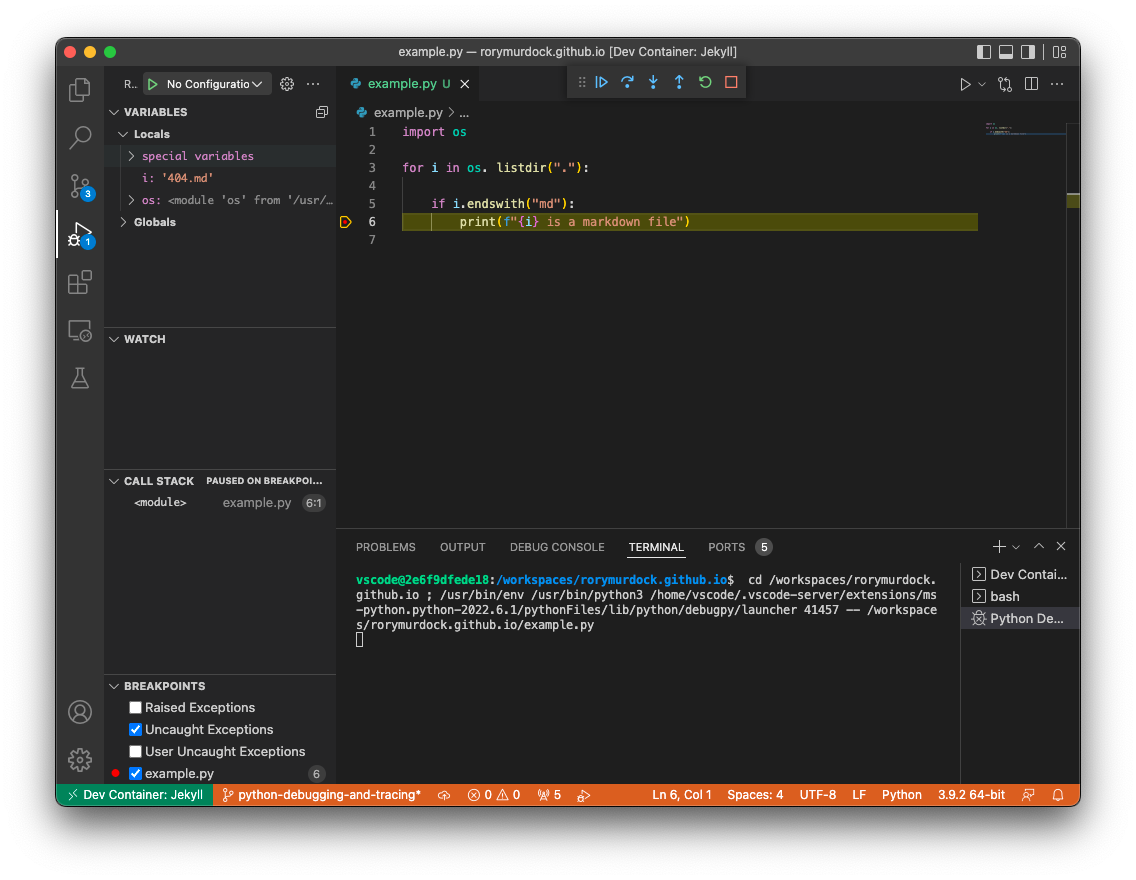
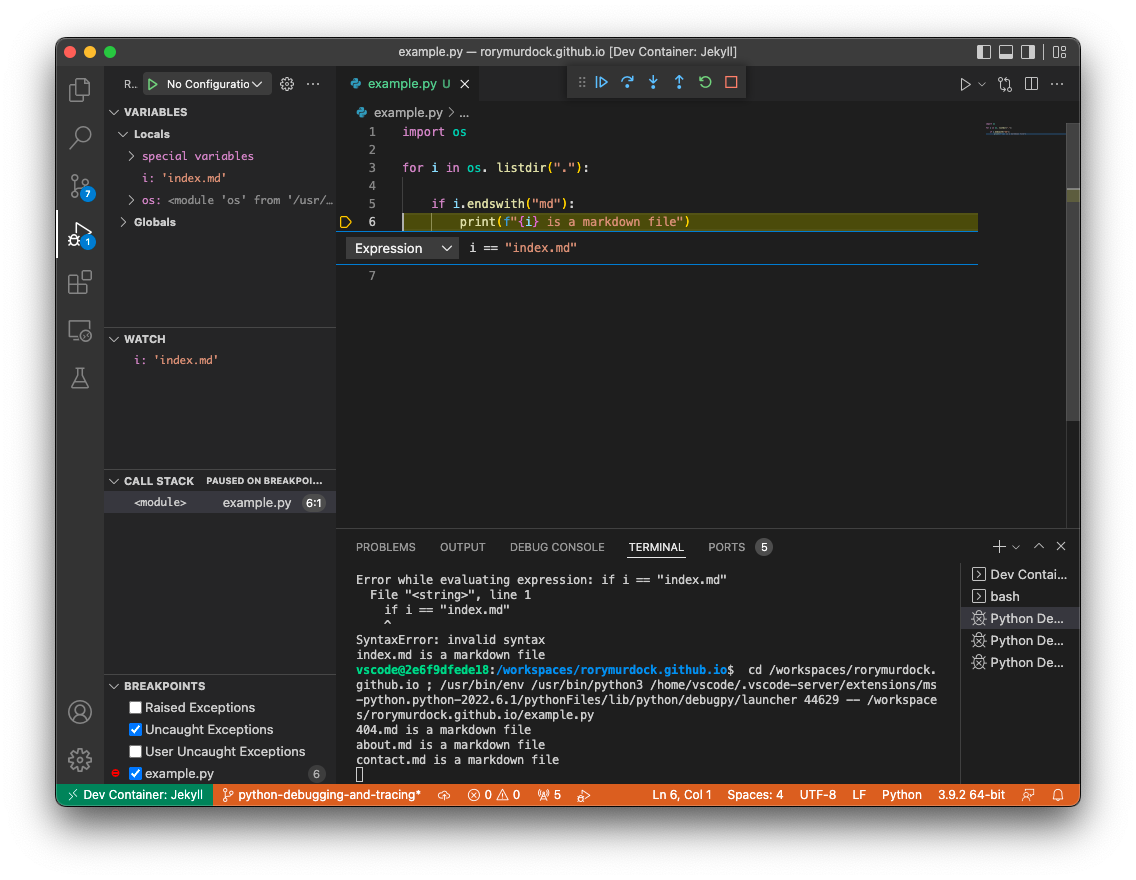
Here we can see on the left side the Variables and their values, i is equal to 404.md as this is an iteration we can continue to the next file that ends in md but pressing the play button to resume execution.
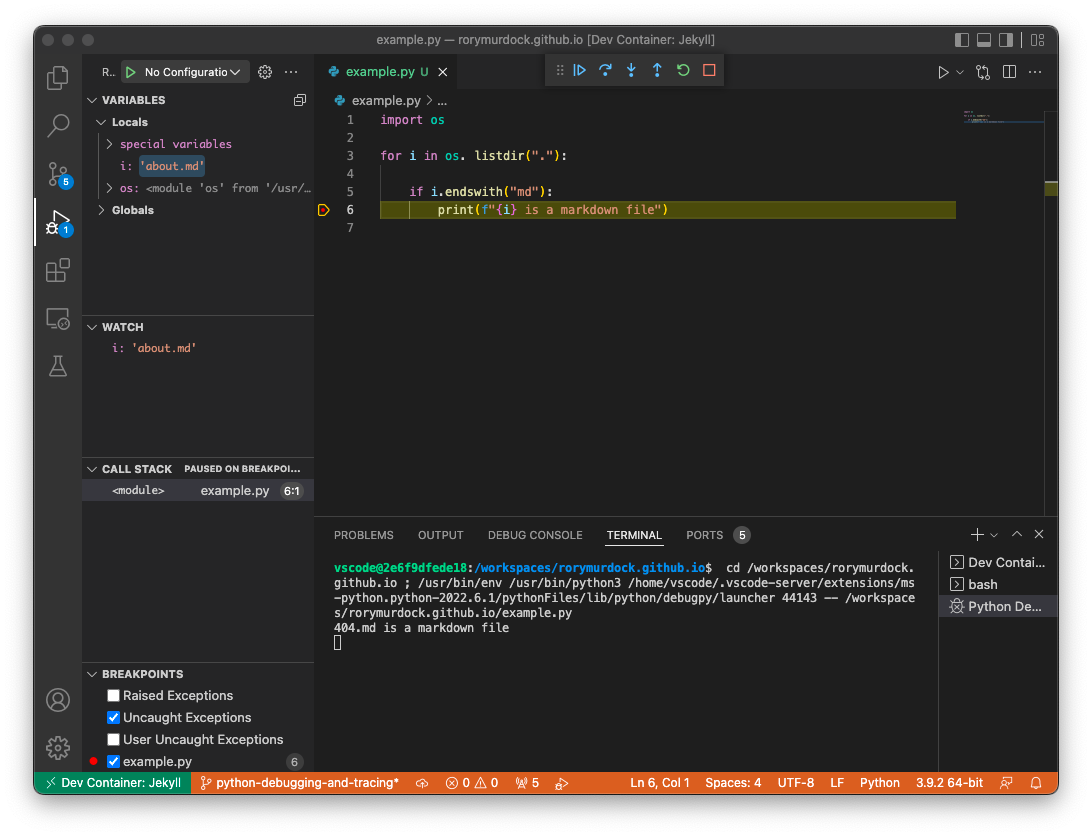
It’s now stopped on the second md file as you an see by the value. I’ve also added i to the watchlist, when you have a large number of variables then watching the ones you want can make it easier instead of hunting through hundreds of objects.
But, what if we have 400 files in this directory? You don’t want to pause -> resume 200 times to file a specific file. You could set a breakpoint in code like this
    if i == "file_201.md":
🔴       print()
and break on it, but instead what we could do is a conditional break that’s basically the same but doesn’t require you to modify the code so there’s no chance of it getting accidentally included.
Pretty neat.
At the top there are some controls, so far we’ve only used the play button but there’s three other options. Rather than explain it myself here’s a stackoverflow that explains it well
-
Step in: means that if there is a function call, it goes inside the function and you can see how the function is executing line by line till it returns and you go back to the next line right after the function call.
-
Step over: means that if there is a function call, it just executes it like a black box and returns the result, but you cannot see how the function was executed.
-
Step out: means that if you have Stepped in a function and now you want to skip seeing how the rest of the function is going to execute, you Step out and the function returns. Then, you go back to the next line, that is the line right after the function call.
You can also track the memory address of the object if you want to know if you’re dealing with the same one
So that’s how to debug in the console, you can also do this with PyTest if you want to see what your tests are doing.
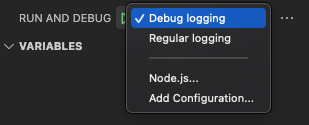
You can set debug configs which is handy for things like env variables and args
{
    // Use IntelliSense to learn about possible attributes.
    // Hover to view descriptions of existing attributes.
    // For more information, visit: https://go.microsoft.com/fwlink/?linkid=830387
    "version": "0.2.0",
    "configurations": [
        {
            "name": "Debug logging",
            "type": "python",
            "request": "launch",
            "program": "${file}",
            "console": "integratedTerminal",
            "justMyCode": true,
            "env": {
                "username": "hello",
                "api_key": "h3ll0"
            },
            "args": [
                "--debug"
            ]
        },
        {
            "name": "Regular logging",
            "type": "python",
            "request": "launch",
            "program": "${file}",
            "console": "integratedTerminal",
            "justMyCode": true,
            "env": {
                "username": "hello",
                "api_key": "h3ll0"
            },
        },
    ]
}
Tracing
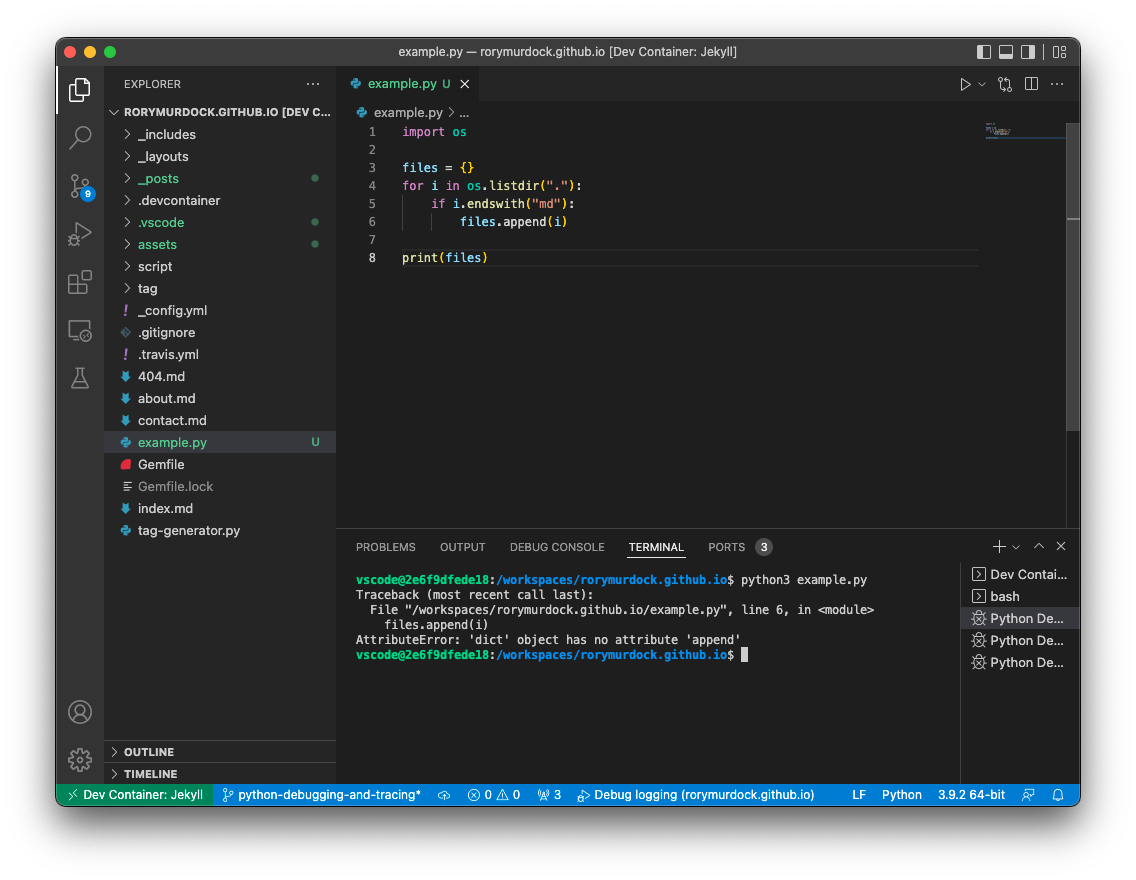
Say you have a complex project and you keep running into a bug and you want to see what’s going on where the exception is thrown, the stacktrace helps, but it’s not enough. What values do the variables have, what’s going on in that function? It would be great to be able to enter the execution at that point and try some things.
Here’s a very simple example, we’re trying to append to a dict not a list.
Well, welcome to set_trace from PDB. PDB is what VS Code is calling behind the scenes during debugging. Here’s a decent guide on using PDB.
import pdb; pdb.set_trace()
When executing the program this drops you in the session at the trace point and you can interact with it.
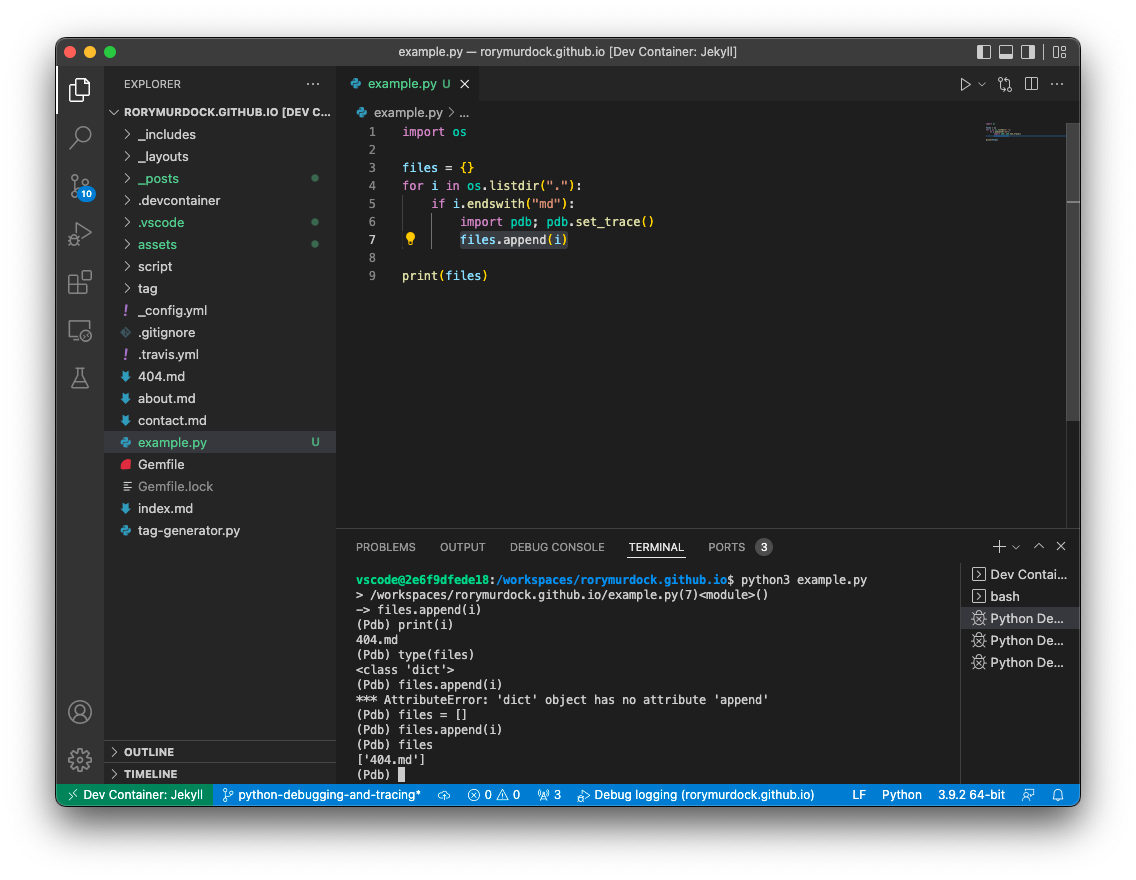
Here I’ve checked what i looks like, the type of files, changed files to a list and then tried the next line to see if that works now. Super easy, and great for testing functions in Pytest using import pytest pytest.set_trace()
This can work well when there’s a bug you just can’t figure out, drop into the execution and go line by line.
Yeah, I know, cool right?
